Interactive PDF infographic Interactive PDF comparison of base miles and actual miles traveled in the Pacific Area, highlighting deviations.
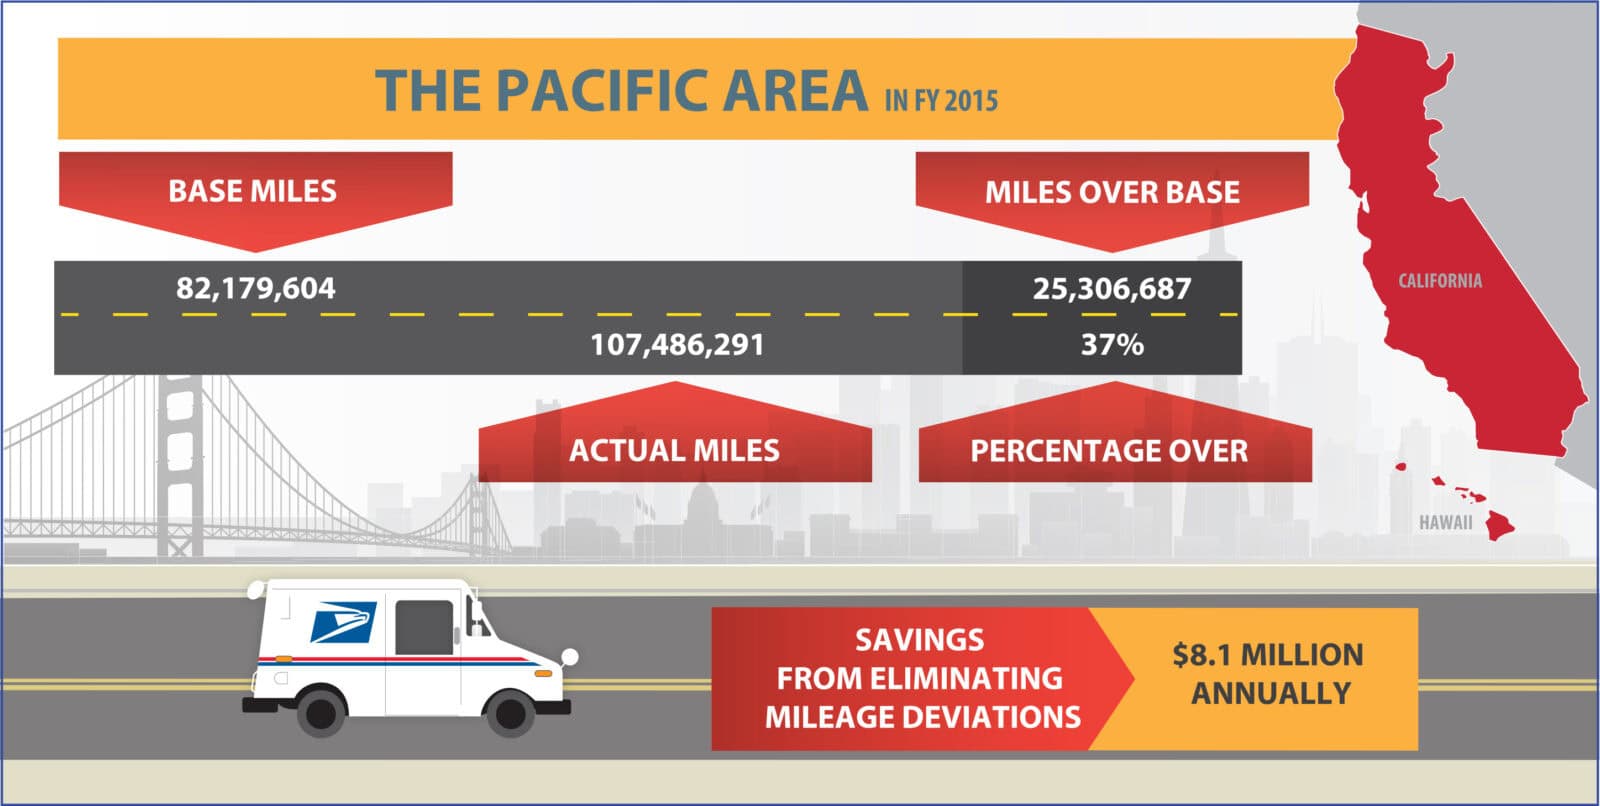 Interactive PDF comparison of base miles and actual miles traveled in the Pacific Area, highlighting deviations.
